Bar3DChart#
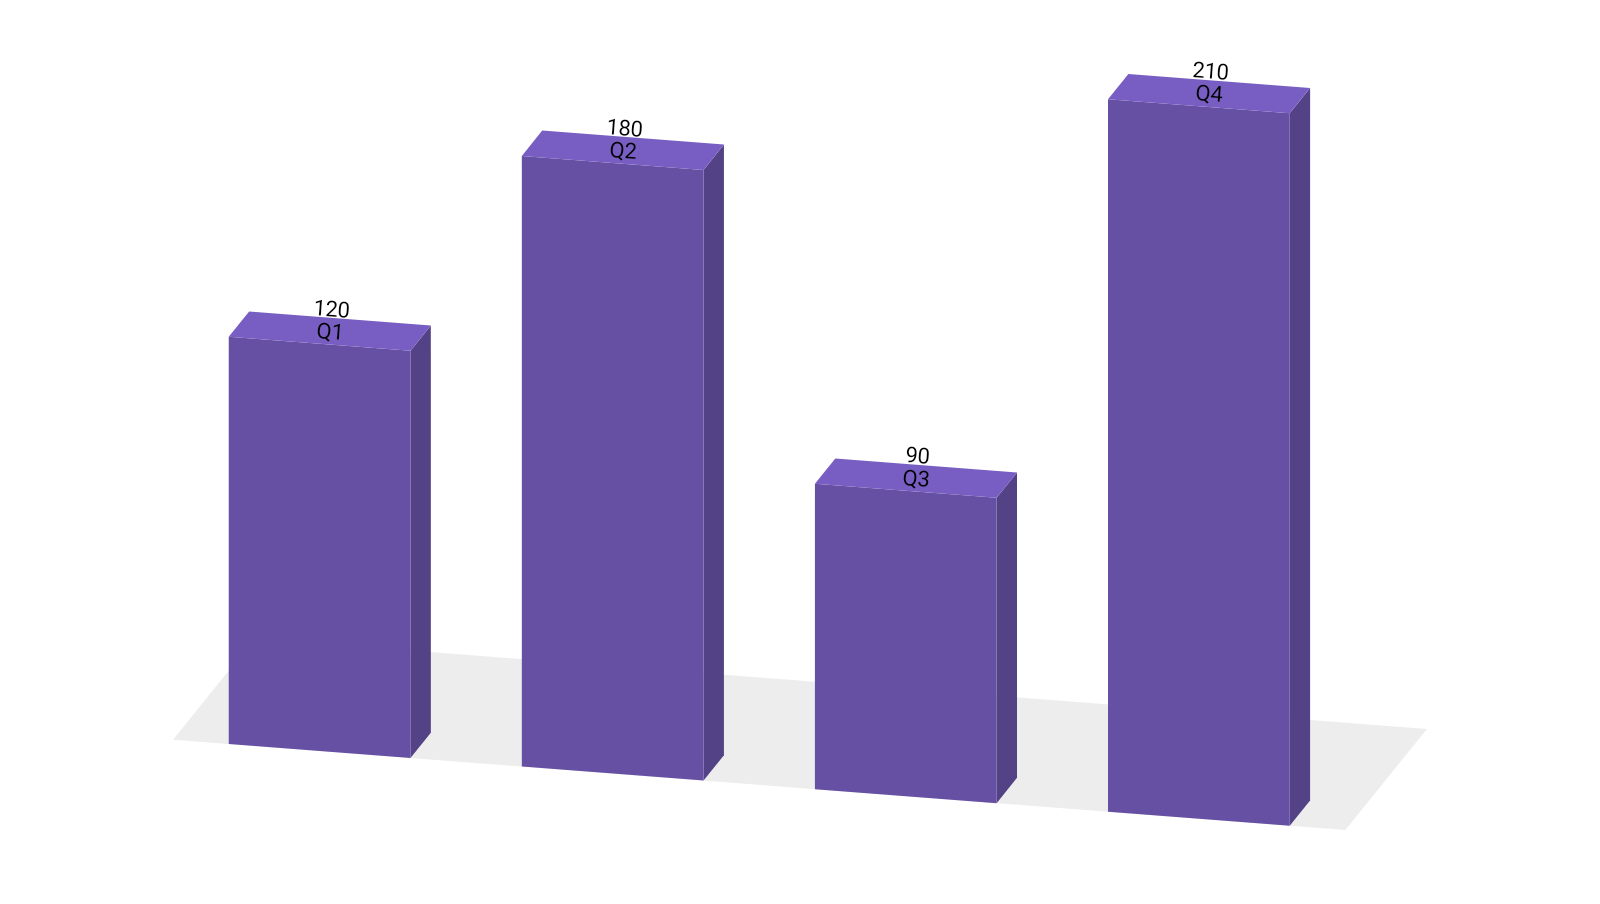
Bars extruded into solids standing on a floor. Best when a bar chart is the headline of a dashboard or a slide and the exact values are read from labels rather than compared by eye.
From the charty-3d artifact, and @ChartyExperimental — see that page for the opt-in.
Bar3DChart( data = { listOf( BarData(label = "Q1", value = 120f), BarData(label = "Q2", value = 180f), BarData(label = "Q3", value = 90f), BarData(label = "Q4", value = 210f), ) }, modifier = Modifier.fillMaxWidth().height(300.dp), color = ChartyColor.Solid(Color(0xFF6650A4)), barConfig = Bar3DChartConfig(showValueLabels = true), onBarClick = { bar -> println("${bar.label}: ${bar.value}") },)Each bar is built as a box; only the faces that actually turn toward the viewer are drawn, so a bar stays solid at any angle — swing the yaw negative and the visible flank swaps sides, tip the pitch below the horizon and you see the underside instead of the top.
Viewing angle#
barConfig = Bar3DChartConfig(projection = Projection3D.Isometric)See Projection3D for the presets and what perspective costs you.
Bar shape#
barConfig = Bar3DChartConfig( barWidthFraction = 0.62f, // how much of its slot a bar fills across barDepthFraction = 0.45f, // how deep it is, as a fraction of its width)barDepthFraction = 0f draws flat bars — a 2D bar chart seen at an angle.
Labels#
barConfig = Bar3DChartConfig( showValueLabels = true, valueFormatter = { value -> "${value.toInt()}k" }, showCategoryLabels = true, categoryLabelPlacement = Bar3DLabelPlacement.AUTO,)Both label kinds are rotated into the plane of the scene, so they read as part of the figure rather than pasted over it, and they follow the angle as it changes.
categoryLabelPlacement decides where a bar's name sits:
| Value | Behaviour |
|---|---|
AUTO (default) | Puts each label where the floor would, checks whether it lands on a bar, and moves them onto the top faces only if it does |
FLOOR | Always beneath the bar, like a flat chart's axis label |
TOP_FACE | Always centred on the bar's top face |
AUTO exists because at a steep yaw the floor beneath one bar sits behind the next one along, so
foot labels start colliding with the bars they name. It measures that rather than guessing an angle.
Floor and background#
barConfig = Bar3DChartConfig( showFloor = true, plotBackground = ChartyColor.Gradient(listOf(tint, Color.Transparent)),)The floor plane gives the eye a ground to read the depth against. plotBackground is null by
default, leaving the chart transparent.
Interaction#
onBarClick resolves nearest face first, so a tap selects the bar you can see rather than one
occluded behind it.
Configuration#
Bar3DChartConfig(projection, barWidthFraction, barDepthFraction, animation, showValueLabels, valueFormatter, valueLabelStyle, showCategoryLabels, categoryLabelPlacement, categoryLabelStyle, showFloor, plotBackground).
Limitations#
- Depth carries no data; see the artifact page for what that costs.
- No axes, grid, tooltip slot, crosshair, markers, reference lines, or rolling window.