GanttChart#
Best for schedules and occupancy — project plans, shift rosters, booking calendars, machine utilisation: anything where each row holds several ranges rather than one.
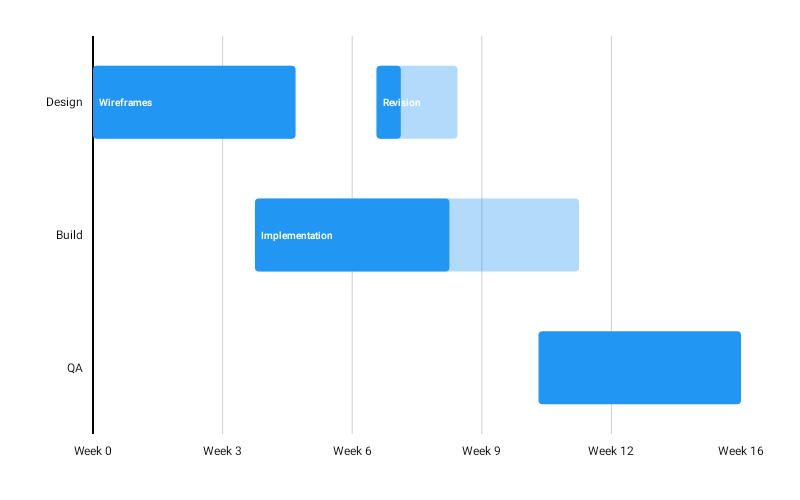
GanttChart( data = { listOf( GanttRow( label = "Design", segments = listOf( GanttSegment(startValue = 0f, endValue = 5f, progress = 1f), GanttSegment(startValue = 7f, endValue = 9f, label = "Revision"), ), ), GanttRow( label = "Build", segments = listOf(GanttSegment(startValue = 4f, endValue = 12f, progress = 0.6f)), ), ) }, modifier = Modifier.fillMaxWidth().height(280.dp), color = ChartyColor.Solid(Color(0xFF6650A4)), onSegmentClick = { selection -> println("${selection.row.label}: ${selection.segment.startValue}") },)One row per label, with any number of segments laid out along the value axis. This is the many-ranges-per-row case that SpanChart cannot express — a span is exactly one range per row, with no per-segment colour, label, or progress.
A segment requires endValue > startValue. Segments of one row must not overlap: overlapping bars on a single row are indistinguishable once drawn, so the constructor throws and names the row. Touching segments are fine, and the order you pass them in does not matter.
Progress#
GanttSegment(startValue = 0f, endValue = 10f, progress = 0.4f)The full segment is drawn at incompleteAlpha, with the completed head at full opacity on top. Leave progress null to draw a plain segment.
The value axis#
The axis is a generic Float continuum — the chart hard-codes no notion of time. To label it as dates, pass a formatter through scaffoldConfig; see Datetime axis and localization.
Floatcannot keep raw epoch-millisecond values distinct. Use offsets from a reference instant, or seconds, and format them on the axis.
Segment labels#
ganttConfig = GanttChartConfig(showSegmentLabels = true)Labels are measured during composition and drawn only where they fit inside their segment.
Tooltip#
tooltip = ChartTooltip.compose { Text(text = "${data.row.label}: ${data.segment.label ?: ""}") }The click and tooltip payload is a GanttSelection — the row plus the segment that was tapped.
Configuration#
GanttChartConfig(barHeightFraction, cornerRadius, animation, incompleteAlpha, showSegmentLabels, segmentLabelStyle, valueFormatter, axisSteps, tooltipConfig, tooltipPosition, visibleWindow).
tooltipConfig defaults to null, meaning the ambient theme styles the tooltip.
Limitations#
- No crosshair, no reference line, and no markers.