PointChart#
Best for scatter-plot style visualization where individual data point positions matter more than connecting trends.
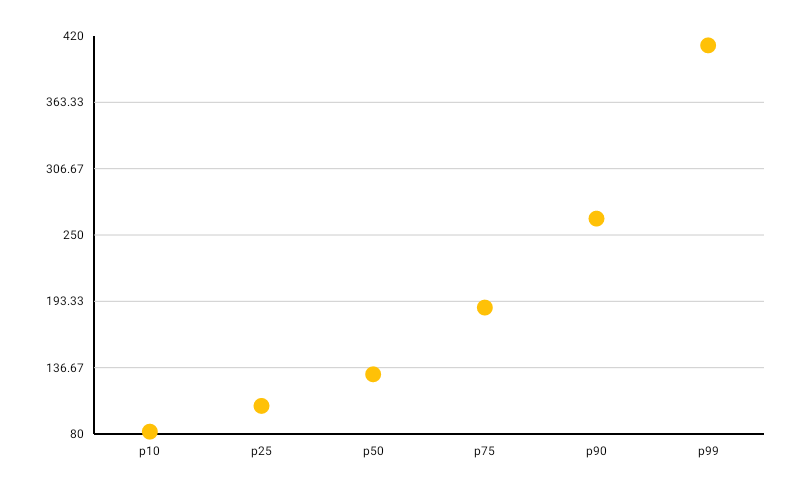
PointChart( data = { listOf( PointData(label = "A", value = 42f), PointData(label = "B", value = 78f), PointData(label = "C", value = 55f), PointData(label = "D", value = 91f), PointData(label = "E", value = 33f), PointData(label = "F", value = 67f), ) }, modifier = Modifier.fillMaxWidth().height(280.dp), color = ChartyColor.Solid(Color(0xFF00897B)), pointConfig = PointChartConfig( pointRadius = 6f, animation = Animation.Default, ), onPointClick = { pointData -> println("Clicked: ${pointData.label} = ${pointData.value}") },)Rolling window#
PointChart( data = { samples }, modifier = Modifier.fillMaxWidth().height(280.dp), color = ChartyColor.Solid(Color(0xFF00897B)), pointConfig = PointChartConfig(visibleWindow = 50, animation = Animation.Fast),)visibleWindow keeps only the last N points on screen and slides as data is appended; null or at least 2.
Persistent markers#
pointConfig = PointChartConfig( visibleWindow = 50, markers = listOf(PersistentMarker(dataIndex = -1, label = "Now", showGuideLine = true)),)A negative dataIndex counts back from the end of the drawn data, so dataIndex = -1 labels the newest point — the idiom for keeping a label pinned to the latest value of a rolling window.
Animating value changes#
pointConfig = PointChartConfig(animateValueChanges = true, animation = Animation.Fast)Selected-column highlight#
pointConfig = PointChartConfig( highlightSelectedColumn = true, selectionColumnColor = ChartyColor.Solid(Color(0x1400897B)),)Shades the vertical band around the selected point so it stands out from its neighbours.
Crosshair#
PointChart( data = { samples }, modifier = Modifier.fillMaxWidth().height(280.dp), color = ChartyColor.Solid(Color(0xFF00897B)), crosshair = ChartCrosshair( config = ChartCrosshairConfig( verticalLineColor = ChartyColor.Solid(Color(0xFF00897B)), dismissOnRelease = true, ), ),)Snaps to the nearest point by x-position on drag, and leaves taps alone. pointConfig.crosshairConfig is the older equivalent; the crosshair parameter wins when both are set.
Tooltip#
PointChart( data = { samples }, modifier = Modifier.fillMaxWidth().height(280.dp), color = ChartyColor.Solid(Color(0xFF00897B)), tooltip = ChartTooltip.compose { Text(text = "${data.label}: ${data.value}") }, pointConfig = PointChartConfig( tooltipFormatter = { pointData -> "${pointData.label}: ${pointData.value}" }, ),)ChartTooltip.canvas() is the default; ChartTooltip.none() disables it.
Downsampling#
pointConfig = PointChartConfig(downsampleThreshold = 500)Caps the number of rendered points using LTTB, which preserves the visible shape of the series. Must be null or at least 3.
Accessibility#
A generated summary ("Point chart, 6 data points. Range: … Peak: … Lowest: …") plus one focusable node per point.
interactionConfig = ChartInteractionConfig(accessibilityDescription = "Response time samples")PointChartConfig#
Shared with BubbleChart.
| Property | Type | Default | Description |
|---|---|---|---|
pointRadius | Float | 8f | Dot radius in pixels; must be greater than 0 |
pointAlpha | Float | 1f | Dot opacity, 0f..1f |
negativeValuesDrawMode | NegativeValuesDrawMode | BELOW_AXIS | BELOW_AXIS or FROM_MIN_VALUE |
animation | Animation | Animation.Default | Entry animation |
animateValueChanges | Boolean | false | Tween values on data change |
referenceLine | ReferenceLineConfig? | null | Optional horizontal guide line |
referenceBand | ReferenceBandConfig? | null | Optional shaded value band |
markers | List<PersistentMarker> | emptyList() | Persistent pinned labels |
tooltipConfig | TooltipConfig? | null (the theme's) | Canvas tooltip appearance |
tooltipPosition | TooltipPosition | AUTO | ABOVE, BELOW, or AUTO |
tooltipFormatter | (PointData) -> String | "label: value" | Tooltip text |
crosshairConfig | ChartCrosshairConfig? | null | Legacy crosshair switch; crosshair takes precedence |
highlightSelectedColumn | Boolean | false | Shades the column of the selected point |
selectionColumnColor | ChartyColor | Solid(#142962FF) | Colour of that shading |
selectionColumnWidth | Float? | null | Fixed shading width; null derives it from spacing |
downsampleThreshold | Int? | null | Max points to render (LTTB); null or >= 3 |
visibleWindow | Int? | null | Rolling "show last N" window; null or >= 2 |