FunnelChart#
Best for stage-by-stage drop-off — a signup or checkout funnel, a hiring pipeline, a support queue.
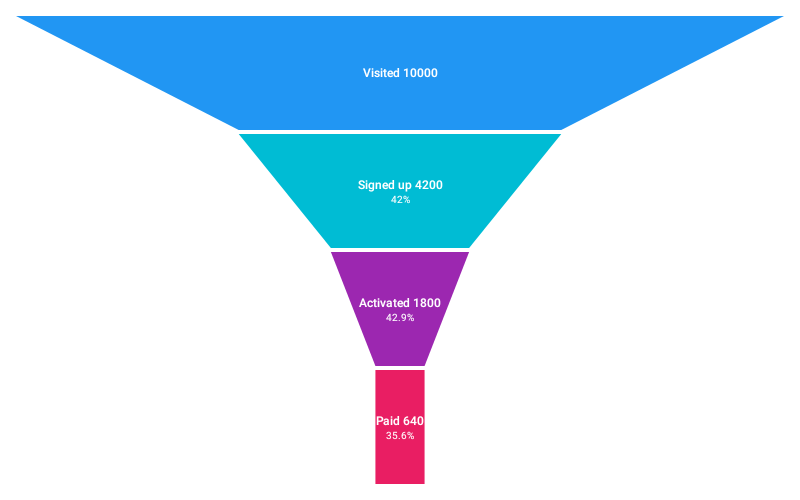
FunnelChart( data = { listOf( FunnelStage(label = "Visited", value = 10_000f), FunnelStage(label = "Signed up", value = 4_200f), FunnelStage(label = "Activated", value = 1_800f), FunnelStage(label = "Paid", value = 640f), ) }, modifier = Modifier.fillMaxWidth().height(320.dp), funnelConfig = FunnelChartConfig(showConversionLabels = true), onStageClick = { stage -> println("${stage.label}: ${stage.value}") },)Each band's width is value / firstValue, tapering from its own width to the next stage's; the last band is a rectangle. A stage may carry its own color, otherwise stageColors is cycled.
Nothing else in Charty tapers width across stages — BlockBarChart splits one constant-thickness bar into proportional segments, and PieChart divides angle.
Orientation#
funnelConfig = FunnelChartConfig(orientation = FunnelOrientation.HORIZONTAL)Vertical is the default, the shape readers expect. Horizontal is a config flag, not a second composable.
Conversion labels#
funnelConfig = FunnelChartConfig( showConversionLabels = true, conversionFormatter = { fraction -> "${(fraction * 100).toInt()}% kept" },)Conversion is measured from the previous stage, not from the first.
Edge cases#
- A first stage of
0fyields all-zero fractions rather than aNaN. - A stage larger than the first is clamped to full width, rather than silently rescaling every other stage.
Accessibility#
FunnelChart is not a Cartesian chart, so it takes a standalone accessibilityDescription parameter instead of reading one from ChartInteractionConfig. It attaches a chart summary plus one focusable node per stage.
Configuration#
FunnelChartConfig(orientation, stageGap, animation, showStageLabels, showConversionLabels, valueFormatter, conversionFormatter, labelStyle, conversionLabelStyle).
Limitations#
- Not a Cartesian chart: no
visibleWindow, no markers, no crosshair, no viewport pan/zoom, and nointeractionConfigparameter. - No tooltip slot —
ChartTooltip.canvas()needs aChartContextthat a non-Cartesian chart has none of. UseonStageClick.