MultipleRadarChart#
Best for comparing multiple entities or time periods across the same set of axes on a single radar.
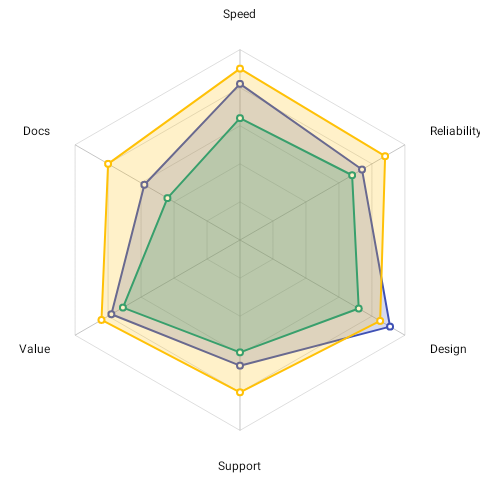
MultipleRadarChart( dataSets = { listOf( RadarDataSet( label = "Current Year", axes = listOf( RadarAxisData(label = "Revenue", value = 90f), RadarAxisData(label = "Satisfaction", value = 75f), RadarAxisData(label = "Growth", value = 60f), RadarAxisData(label = "Retention", value = 85f), RadarAxisData(label = "Efficiency", value = 70f), ), color = ChartyColor.Solid(Color(0xFF6650A4)), ), RadarDataSet( label = "Previous Year", axes = listOf( RadarAxisData(label = "Revenue", value = 70f), RadarAxisData(label = "Satisfaction", value = 65f), RadarAxisData(label = "Growth", value = 80f), RadarAxisData(label = "Retention", value = 60f), RadarAxisData(label = "Efficiency", value = 55f), ), color = ChartyColor.Solid(Color(0xFFE91E63)), fillAlpha = 0.2f, ), ) }, modifier = Modifier.size(320.dp), config = MultipleRadarChartConfig( showLegend = true, legendPosition = LegendPosition.BOTTOM, ), onDataSetClick = { dataSet, index -> println("Tapped ${dataSet.label} (index $index)") }, accessibilityDescription = "Year-over-year comparison across five business metrics",)Note the parameter name: dataSets, not data.
Each RadarDataSet must carry its own color: ChartyColor — there is no automatic palette. fillAlpha (default 0.3f) tunes how opaque each overlapping polygon is; lower it when polygons overlap heavily.
Every data set needs at least three axes, and all sets should declare the same axes in the same order — the number of axes is taken from the first data set.
Click data: onDataSetClick(dataSet: RadarDataSet, index: Int) — it receives the whole RadarDataSet, not just its label.
Legend#
config = MultipleRadarChartConfig( showLegend = true, legendPosition = LegendPosition.TOP_RIGHT, legendTextStyle = TextStyle(fontSize = 12.sp),)LegendPosition covers TOP, BOTTOM, LEFT, RIGHT, and the four corners; the corner positions overlay the legend on the radar, the edge positions place it beside the radar.
Staggered entry#
config = MultipleRadarChartConfig( staggerAnimation = true, staggerDelay = 0.2f,)Data sets animate in one after another. staggerDelay must be in 0f..0.5f.
Per-dataset styling#
config = MultipleRadarChartConfig( radarConfig = RadarChartConfig( gridConfig = RadarGridConfig(gridStyle = RadarGridStyle.CIRCULAR), ), datasetLineWidth = 3f, datasetPointRadius = 5f, showPointInnerCircle = true,)radarConfig carries all the shared radar styling — see RadarChart for its full table. datasetLineWidth and datasetPointRadius override the corresponding radarConfig values for the data polygons when set.
Accessibility#
The chart attaches a generated summary ("Multiple radar chart, 2 datasets, 5 axes each. Dataset: … Dataset: …"). Override it with accessibilityDescription, or pass an empty string to suppress it.
MultipleRadarChartConfig#
| Property | Type | Default | Description |
|---|---|---|---|
radarConfig | RadarChartConfig | RadarChartConfig() | Shared grid, label, animation, and geometry settings |
showLegend | Boolean | false | Draws the data-set legend |
legendPosition | LegendPosition | TOP | TOP, BOTTOM, LEFT, RIGHT, or a corner |
legendTextStyle | TextStyle | 12 sp | Legend text style |
staggerAnimation | Boolean | true | Animates data sets in sequence |
staggerDelay | Float | 0.15f | Delay between data sets; 0f..0.5f |
datasetLineWidth | Float? | null | Overrides radarConfig.dataLineWidth; must be positive |
datasetPointRadius | Float? | null | Overrides radarConfig.dataPointRadius; non-negative |
showPointInnerCircle | Boolean | true | Draws an inner circle inside each vertex dot |
Limitations#
- Not a Cartesian chart: no
visibleWindow, nomarkers, noanimateValueChanges, no crosshair, no tooltip slot. - There is no per-axis click callback here; that is on RadarChart as
onAxisClick.
Values#
RadarLabelConfig.showValues draws each axis's value for every data set. With
RadarValuePlacement.DATA_POINT (the default) each value sits just outside its own vertex, so it
follows the shape it belongs to. With RadarValuePlacement.BELOW_AXIS_LABEL the values stack
beneath each axis name in data-set order — one row per data set, all styled by the shared
valueTextStyle. Give the label ring room for the stack with paddingFraction (the goldens use
0.22f for two data sets); the chart does not yet reserve that space itself.
config = MultipleRadarChartConfig( radarConfig = RadarChartConfig( labelConfig = RadarLabelConfig( showValues = true, valuePlacement = RadarValuePlacement.BELOW_AXIS_LABEL, ), ),)