ComparisonBarChart#
Best for comparing multiple values (e.g. two metrics side by side) within the same category group — each BarGroup renders its values as individual bars clustered together.
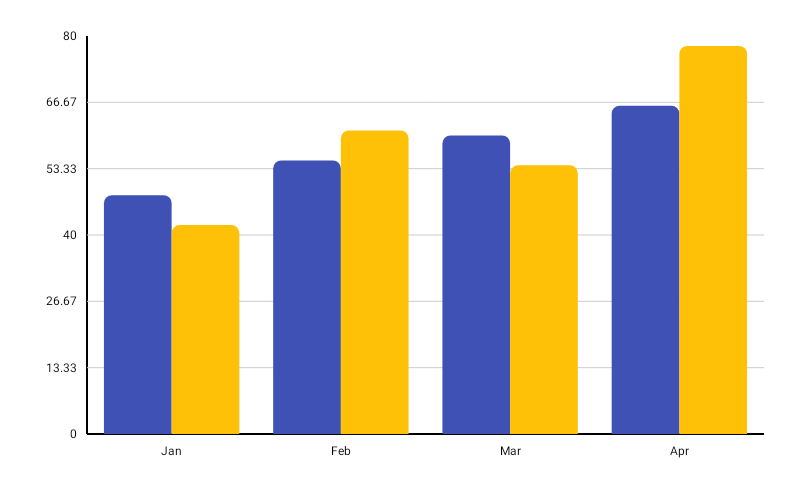
ComparisonBarChart( data = { listOf( BarGroup( label = "Q1", values = listOf(120f, 95f), colors = listOf( ChartyColor.Solid(Color(0xFF6650A4)), ChartyColor.Solid(Color(0xFFE91E63)), ), ), BarGroup( label = "Q2", values = listOf(180f, 140f), colors = listOf( ChartyColor.Solid(Color(0xFF6650A4)), ChartyColor.Solid(Color(0xFFE91E63)), ), ), ) }, modifier = Modifier.fillMaxWidth().height(300.dp), comparisonConfig = ComparisonBarChartConfig( cornerRadius = CornerRadius.Medium, animation = Animation.Default, ), onBarClick = { segment -> println("Group: ${segment.barGroup.label}, bar ${segment.barIndex} = ${segment.barValue}") },)ComparisonBarChart has no chart-level colour parameter, so every BarGroup must carry a colors list — the chart throws while drawing if colors is null or shorter than values. (BarGroup itself already rejects a colors list whose size differs from values.)
Click data: ComparisonBarSegment(barGroup, barIndex, barValue)
Corner radius#
comparisonConfig = ComparisonBarChartConfig(cornerRadius = CornerRadius.Custom(radius = 10f))Applies to bar tops for positive values and bar bottoms for negative ones. None, Small, Medium, Large, ExtraLarge, or Custom(radius).
Rolling window#
comparisonConfig = ComparisonBarChartConfig(visibleWindow = 12, animation = Animation.Fast)Keeps only the last N groups on screen; null or at least 2.
Persistent markers#
comparisonConfig = ComparisonBarChartConfig( visibleWindow = 12, markers = listOf(PersistentMarker(dataIndex = -1, label = "Latest")),)A negative dataIndex counts back from the end of the drawn data, so -1 marks the newest group.
Animating value changes#
comparisonConfig = ComparisonBarChartConfig(animateValueChanges = true, animation = Animation.Fast)Tooltip#
ComparisonBarChart( data = { groups }, modifier = Modifier.fillMaxWidth().height(300.dp), tooltip = ChartTooltip.canvas(), comparisonConfig = ComparisonBarChartConfig( tooltipFormatter = { segment -> "${segment.barGroup.label}: ${segment.barValue}" }, ),)Crosshair#
The crosshair snaps per group, not per bar — one guide line cannot sit on several bars, and the x axis is labelled by group. It rests on the top of the group's tallest bar and reports that bar as a ComparisonBarSegment, so the label reads the tallest bar's value. Ties resolve to the earlier bar.
Taps are untouched: the crosshair runs as its own gesture, so tapping still raises the tooltip and fires the click callback. Streaming scrollback does not survive a crosshair — the crosshair owns the drag.
Accessibility#
A generated summary plus one focusable node per group.
interactionConfig = ChartInteractionConfig(accessibilityDescription = "Plan versus actual, by quarter")ComparisonBarChartConfig#
| Property | Type | Default | Description |
|---|---|---|---|
negativeValuesDrawMode | NegativeValuesDrawMode | BELOW_AXIS | BELOW_AXIS or FROM_MIN_VALUE |
cornerRadius | CornerRadius | CornerRadius.Medium | Rounds the value end of each bar |
animation | Animation | Animation.Default | Entry animation (800 ms tween) |
animateValueChanges | Boolean | false | Tween bar values on data change |
referenceLine | ReferenceLineConfig? | null | Optional horizontal guide line |
markers | List<PersistentMarker> | emptyList() | Persistent pinned labels |
tooltipConfig | TooltipConfig? | null (the theme's) | Canvas tooltip appearance |
tooltipPosition | TooltipPosition | AUTO | ABOVE, BELOW, or AUTO |
tooltipFormatter | (ComparisonBarSegment) -> String | "label [i]: value" | Tooltip text |
visibleWindow | Int? | null | Rolling "show last N" window; null or >= 2 |
There is no barWidthFraction on this config — bar widths are derived from the group count.
Limitations#
- No data labels.