MultilineChart#
Best for comparing multiple data series on a single set of axes.
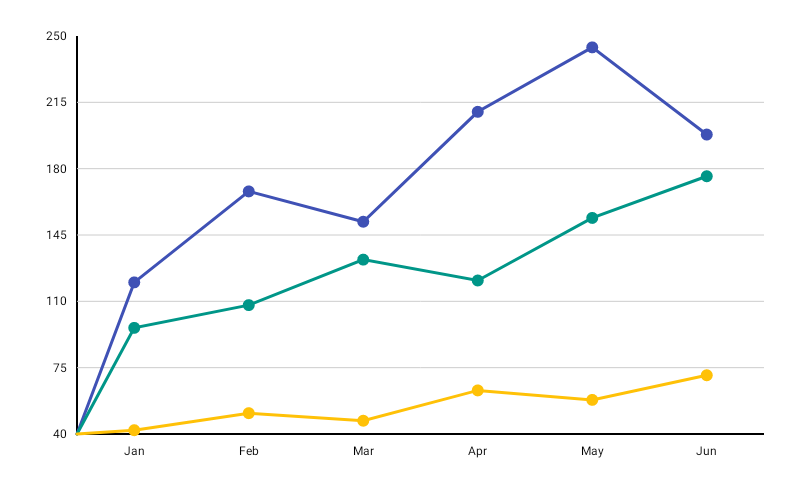
MultilineChart( data = { listOf( LineGroup(label = "Jan", values = listOf(100f, 80f, 60f)), LineGroup(label = "Feb", values = listOf(120f, 95f, 70f)), LineGroup(label = "Mar", values = listOf(90f, 110f, 85f)), LineGroup(label = "Apr", values = listOf(150f, 130f, 100f)), ) }, modifier = Modifier.fillMaxWidth().height(320.dp), colors = ChartyColor.Gradient( listOf(Color(0xFF6650A4), Color(0xFFE91E63), Color(0xFF00BCD4)), ), lineConfig = LineChartConfig( lineWidth = 2f, showPoints = true, interpolation = LineInterpolation.SMOOTH, animation = Animation.Default, ), onPointClick = { point -> println("Series ${point.seriesIndex} in ${point.lineGroup.label}") },)Each LineGroup.values list is one x-position across all series, so every group should carry the same number of values. The colors gradient supplies one colour per series.
Click data: MultilinePoint(lineGroup, seriesIndex, dataIndex, value)
Interpolation#
MultilineChart honours LineInterpolation — every series is drawn with the same interpolation. Earlier versions of the library ignored this setting on this chart; it is applied now.
lineConfig = LineChartConfig(interpolation = LineInterpolation.STEP)Legend#
MultilineChart( data = { groups }, modifier = Modifier.fillMaxWidth().height(320.dp), colors = ChartyColor.Gradient(listOf(Color(0xFF6650A4), Color(0xFFE91E63), Color(0xFF00BCD4))), lineConfig = LineChartConfig( legendLabels = listOf("Revenue", "Expenses", "Profit"), legendTextStyle = TextStyle(fontSize = 12.sp), ),)Gradient fill under each series#
lineConfig = LineChartConfig( showGradientFill = true, gradientFillAlpha = 0.25f, legendLabels = listOf("Revenue", "Expenses", "Profit"),)The fill is drawn before the line so the line renders on top. Each series gets its own colour from the list at the reduced gradientFillAlpha opacity.
Rolling window#
MultilineChart( data = { groups }, modifier = Modifier.fillMaxWidth().height(320.dp), colors = ChartyColor.Gradient(listOf(Color(0xFF6650A4), Color(0xFFE91E63))), lineConfig = LineChartConfig(visibleWindow = 40, animation = Animation.Fast),)The window applies to the list of LineGroups, so all series slide together. It must be null or at least 2.
Animating value changes#
lineConfig = LineChartConfig(animateValueChanges = true, animation = Animation.Fast)Crosshair#
MultilineChart( data = { groups }, modifier = Modifier.fillMaxWidth().height(320.dp), colors = ChartyColor.Gradient(listOf(Color(0xFF6650A4), Color(0xFFE91E63), Color(0xFF00BCD4))), crosshair = ChartCrosshair(config = ChartCrosshairConfig(dismissOnRelease = true)),)The crosshair snaps to the nearest x-position and its built-in label shows every series value at that point. lineConfig.crosshairConfig is the older equivalent; the crosshair parameter wins when both are set.
Tooltip#
MultilineChart has no tooltip parameter — tapping a point raises the built-in canvas tooltip only. Style it through lineConfig.tooltipConfig and lineConfig.tooltipPosition.
lineConfig = LineChartConfig( tooltipConfig = TooltipConfig(showArrow = false), tooltipPosition = TooltipPosition.ABOVE,)lineConfig.tooltipFormatter is not used here: the tooltip text is generated as "<group label> Line <n>: <value>". If you need different text, use the crosshair with a custom label composable instead.
Accessibility#
The chart attaches a generated multiline summary ("Multiline chart, 4 data points, 3 series. Range: …") plus one focusable node per x-position.
interactionConfig = ChartInteractionConfig(accessibilityDescription = "Revenue, expenses and profit by month")Configuration#
MultilineChart uses LineChartConfig; see the full table on the LineChart page.
Limitations#
markersis present onLineChartConfigbutMultilineChartdoes not draw persistent markers.referenceBandis honoured, butreferenceLineis not drawn on this chart.highlightSelectedColumnandfillAlphaare single-series properties and have no effect here.