CandlestickChart#
Best for financial time-series data (OHLC) such as stock prices or commodity values.
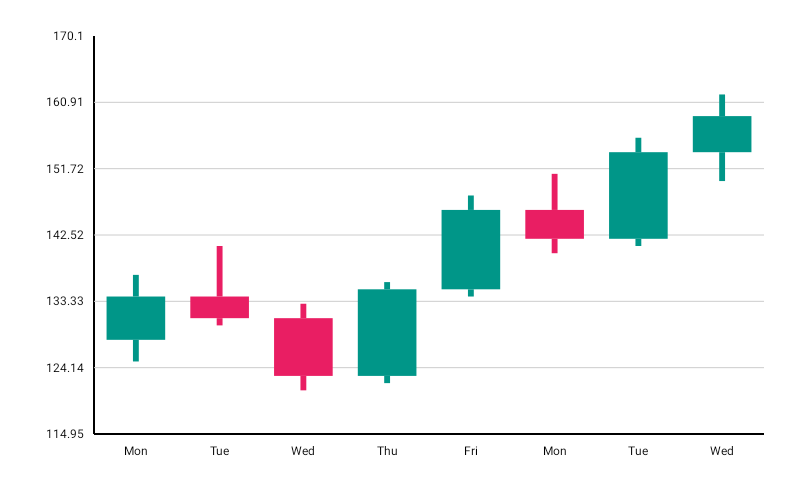
CandlestickChart( data = { listOf( CandleData(label = "Mon", open = 100f, high = 115f, low = 95f, close = 110f), CandleData(label = "Tue", open = 110f, high = 120f, low = 105f, close = 108f), CandleData(label = "Wed", open = 108f, high = 125f, low = 100f, close = 120f), CandleData(label = "Thu", open = 120f, high = 130f, low = 112f, close = 115f), CandleData(label = "Fri", open = 115f, high = 118f, low = 108f, close = 112f), ) }, modifier = Modifier.fillMaxWidth().height(320.dp), bullishColor = ChartyColor.Solid(Color(0xFF26A69A)), bearishColor = ChartyColor.Solid(Color(0xFFEF5350)), candlestickConfig = CandlestickChartConfig( candleWidthFraction = 0.7f, showWicks = true, animation = Animation.Default, ),)Bullish and bearish colours are chart parameters, not config properties — CandlestickChartConfig has no colour settings.
CandleData validates itself at construction: high >= low, and both open and close must lie between low and high. It exposes isBullish, isBearish, bodyHeight, upperWickLength, lowerWickLength, isDoji(threshold), and an optional volume.
Rolling window#
candlestickConfig = CandlestickChartConfig(visibleWindow = 60, animation = Animation.Fast)Keeps only the last N candles on screen and slides as new candles arrive — the natural fit for a live price feed. Must be null or at least 2.
Persistent markers#
Markers anchor to each candle's close price.
candlestickConfig = CandlestickChartConfig( visibleWindow = 60, markers = listOf(PersistentMarker(dataIndex = -1, showGuideLine = true)),)A negative dataIndex counts back from the end of the drawn data, so dataIndex = -1 labels the latest close — the idiom for a "last price" callout on a rolling window. With no label the marker shows the formatted close value.
Animating value changes#
candlestickConfig = CandlestickChartConfig(animateValueChanges = true, animation = Animation.Fast)Candle bodies and wicks tween to their new prices when the data changes.
Scroll and zoom#
Long series are handled through interactionConfig:
CandlestickChart( data = { candles }, modifier = Modifier.fillMaxWidth().height(320.dp), interactionConfig = ChartInteractionConfig( viewPortState = rememberViewPortState(), autoScrollToLatest = true, ),)A viewPortState enables pinch-to-zoom and pan; autoScrollToLatest = true keeps the viewport following the newest candles as the dataset grows.
Accessibility#
A generated summary ("Candlestick chart, 5 candles. Price range: … Latest close: …") plus one focusable node per candle.
interactionConfig = ChartInteractionConfig(accessibilityDescription = "AAPL daily candles, last five sessions")CandlestickChartConfig#
| Property | Type | Default | Description |
|---|---|---|---|
candleWidthFraction | Float | 0.7f | Body width as a fraction of its slot; 0f..1f |
wickWidthFraction | Float | 0.1f | Wick width as a fraction of its slot; 0f..1f |
minCandleBodyHeight | Float | 2f | Floor height so a doji stays visible; non-negative |
showWicks | Boolean | true | Draws the high/low wicks |
cornerRadius | CornerRadius | CornerRadius.None | Body corner rounding; also accepts CornerRadius.Custom(radius) |
animation | Animation | Animation.Default | Entry animation |
animateValueChanges | Boolean | false | Tween prices on data change |
markers | List<PersistentMarker> | emptyList() | Persistent pinned labels on the close |
visibleWindow | Int? | null | Rolling "show last N" window; null or >= 2 |
Limitations#
- No click callback and no crosshair.
CandlestickCharthas noonCandleClickand no crosshair settings on its config. scaffoldConfigstyles the axes, grid, and label text style; it has no price formatter, so format prices into eachCandleData.labelif you need custom axis text.