WavyChart#
Best for drawing attention to a trend with continuously animated bars. Each bar is a stroked vertical sine wave running from its value down to the baseline, not a filled rectangle.
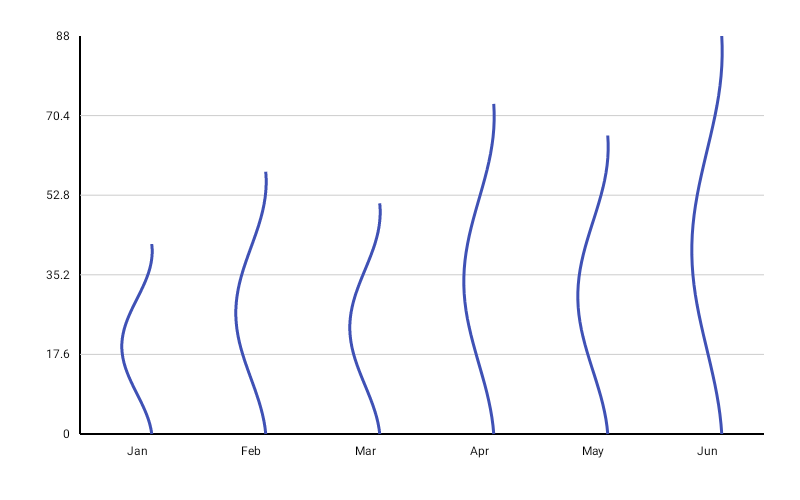
WavyChart( data = { listOf( BarData(label = "Mon", value = 150f), BarData(label = "Tue", value = 90f), BarData(label = "Wed", value = 210f), BarData(label = "Thu", value = 130f), ) }, modifier = Modifier.fillMaxWidth().height(300.dp), color = ChartyColor.Solid(Color(0xFF6650A4)), wavyConfig = WavyChartConfig( barWidthFraction = 0.8f, waveAmplitudeFractionOfBarWidth = 0.25f, waveSegments = 40, strokeWidthDp = 3f, animationDurationMillis = 800, animationEasing = FastOutSlowInEasing, phaseOffsetPerBar = 0.3f, ),)The wave animation is a continuously repeating phase shift — animationDurationMillis is the period of one full cycle, not a one-shot entry duration, and it never settles. WavyChartConfig has no Animation property.
Wave shape#
waveAmplitudeFractionOfBarWidth— how pronounced the wave is;0fgives a straight line, the default is1f/3fwaveSegments— smoothness of the curve at the cost of draw calls; the default is40strokeWidthDp— thickness of the wave strokephaseOffsetPerBar— staggers the phase across bars for a cascading ripple;0f(default) keeps every bar in sync
wavyConfig = WavyChartConfig( waveAmplitudeFractionOfBarWidth = 0.4f, waveSegments = 64, phaseOffsetPerBar = 0.5f,)Rolling window#
wavyConfig = WavyChartConfig(visibleWindow = 12)Keeps only the last N bars on screen; null or at least 2.
Persistent markers#
wavyConfig = WavyChartConfig( visibleWindow = 12, markers = listOf(PersistentMarker(dataIndex = -1, label = "Now")),)A negative dataIndex counts back from the end of the drawn data, so -1 marks the newest bar.
Animating value changes#
wavyConfig = WavyChartConfig(animateValueChanges = true)Bar heights tween to their new values when the data changes, independently of the ongoing wave motion.
Crosshair#
crosshair is a parameter of the chart, not of the config — WavyChartConfig has no crosshairConfig.
WavyChart( data = { series }, modifier = Modifier.fillMaxWidth().height(300.dp), color = ChartyColor.Solid(Color(0xFF6650A4)), crosshair = ChartCrosshair(config = ChartCrosshairConfig(showHorizontalLine = false)),)Accessibility#
A generated summary ("Wavy chart, N data points.") plus one focusable node per bar.
interactionConfig = ChartInteractionConfig(accessibilityDescription = "Weekly engagement")WavyChartConfig#
| Property | Type | Default | Description |
|---|---|---|---|
barWidthFraction | Float | 0.8f | Wave width as a fraction of its slot; 0f..1f |
waveAmplitudeFractionOfBarWidth | Float | 1f/3f | Wave amplitude relative to bar width; non-negative |
waveSegments | Int | 40 | Line segments per wave; at least 1 |
animationDurationMillis | Int | 500 | Period of one full wave cycle; must be positive |
animationEasing | Easing | FastOutSlowInEasing | Easing of the wave cycle |
strokeWidthDp | Float | 3f | Stroke thickness in dp; must be positive |
phaseOffsetPerBar | Float | 0f | Phase stagger between adjacent bars |
animateValueChanges | Boolean | false | Tween values on data change |
markers | List<PersistentMarker> | emptyList() | Persistent pinned labels |
visibleWindow | Int? | null | Rolling "show last N" window; null or >= 2 |
Limitations#
- No tooltip and no click callback —
WavyCharthas notooltipparameter, noonBarClick, and no tooltip settings on its config. The crosshair is the only way to read a value. - No corner radius, reference line, or data labels.