SpanChart#
Best for displaying start-to-end ranges — confidence intervals, temperature highs and lows, bid-ask spreads, Gantt-like durations.
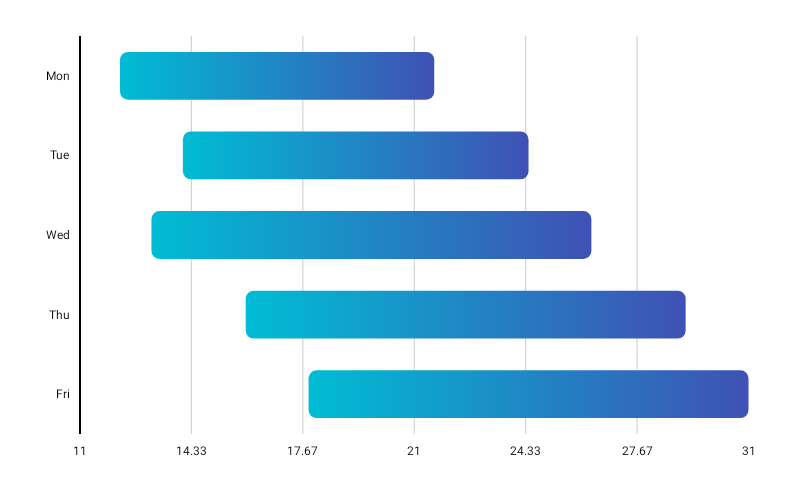
SpanChart( data = { listOf( SpanData(label = "Jan", startValue = 2f, endValue = 10f), SpanData(label = "Feb", startValue = 5f, endValue = 14f), SpanData(label = "Mar", startValue = 8f, endValue = 18f), SpanData(label = "Apr", startValue = 12f, endValue = 22f), ) }, modifier = Modifier.fillMaxWidth().height(280.dp), colors = ChartyColor.Gradient(listOf(Color(0xFF6650A4), Color(0xFF03DAC5))), barConfig = BarChartConfig( cornerRadius = CornerRadius.Large, animation = Animation.Default, ), onSpanClick = { spanData -> println("Range: ${spanData.startValue}–${spanData.endValue}") },)The fields are startValue and endValue (not minValue/maxValue), and SpanData requires endValue >= startValue.
SpanChart is a horizontal chart: one row per label, each row a floating bar running from startValue to endValue along the value axis. A SpanData may carry its own color: ChartyColor?, overriding the chart-level colors.
Colours#
A ChartyColor.Gradient is painted horizontally across each span, from its start to its end.
colors = ChartyColor.Gradient(listOf(Color(0xFF6650A4), Color(0xFF03DAC5)))Corner radius#
barConfig = BarChartConfig(cornerRadius = CornerRadius.Custom(radius = 18f))The radius is applied to all four corners, so a large value gives fully rounded capsule ends.
Rolling window#
barConfig = BarChartConfig(visibleWindow = 15, animation = Animation.Fast)Keeps only the last N spans on screen; null or at least 2.
Persistent markers#
Markers anchor to the centre of each span's end.
barConfig = BarChartConfig( visibleWindow = 15, markers = listOf(PersistentMarker(dataIndex = -1, label = "Latest")),)A negative dataIndex counts back from the end of the drawn data, so -1 marks the newest span.
Animating value changes#
barConfig = BarChartConfig(animateValueChanges = true, animation = Animation.Fast)Tooltip#
SpanChart( data = { spans }, modifier = Modifier.fillMaxWidth().height(280.dp), colors = ChartyColor.Solid(Color(0xFF6650A4)), tooltip = ChartTooltip.compose { Text(text = "${data.label}: ${data.startValue}–${data.endValue}") },)The canvas tooltip (ChartTooltip.canvas(), the default) is styled by barConfig.tooltipConfig and barConfig.tooltipPosition. Its text is generated as "<label>: <start> - <end>"; barConfig.tooltipFormatter is not used, because that formatter takes a BarData and this chart works with SpanData.
Crosshair#
A span has a start and an end, so the guide rests on the centre of each span's end edge — the point its length reads to, and where its marker is pinned. SpanChart is horizontal, so the crosshair snaps along y and its guide line is horizontal. The label reads the whole range, label: start - end, the same text a tap shows.
Taps are untouched: the crosshair runs as its own gesture, so tapping still raises the tooltip and fires the click callback. Streaming scrollback does not survive a crosshair — the crosshair owns the drag.
Accessibility#
The chart attaches a summary ("Span chart, N spans.") plus one focusable node per span, each announcing its label and its start-to-end range.
interactionConfig = ChartInteractionConfig(accessibilityDescription = "Monthly temperature range")Configuration#
SpanChart uses BarChartConfig; see the full table on the BarChart page. The properties that apply here are barWidthFraction (span thickness), cornerRadius, animation, animateValueChanges, markers, tooltipConfig, tooltipPosition, and visibleWindow.
Limitations#
negativeValuesDrawMode,referenceLine,referenceBand,showDataLabels, andtooltipFormatterfromBarChartConfighave no effect here.