StackedAreaChart#
Best for showing how multiple series combine to form a cumulative total, emphasizing both individual contributions and the whole.
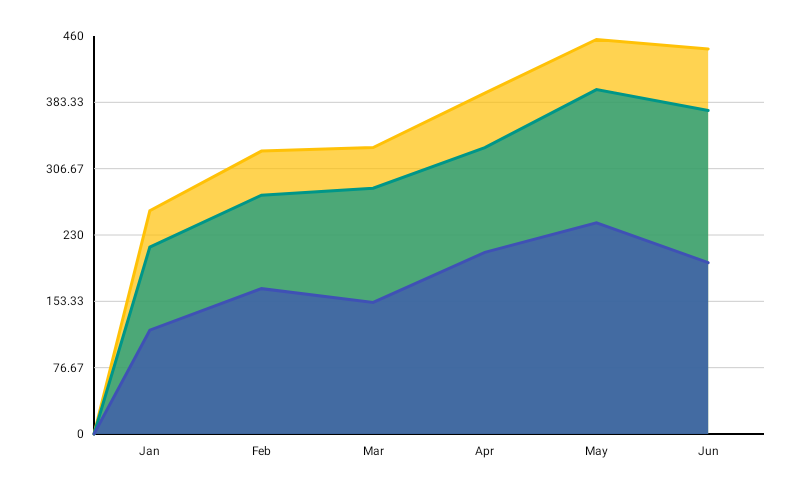
StackedAreaChart( data = { listOf( LineGroup(label = "Q1", values = listOf(200f, 150f, 100f)), LineGroup(label = "Q2", values = listOf(250f, 180f, 120f)), LineGroup(label = "Q3", values = listOf(300f, 200f, 140f)), LineGroup(label = "Q4", values = listOf(280f, 220f, 160f)), ) }, modifier = Modifier.fillMaxWidth().height(320.dp), colors = ChartyColor.Gradient( listOf(Color(0xFF6650A4), Color(0xFFE91E63), Color(0xFF00BCD4)), ), lineConfig = LineChartConfig( interpolation = LineInterpolation.SMOOTH, legendLabels = listOf("Series A", "Series B", "Series C"), animation = Animation.Default, ), fillAlpha = 0.5f, onAreaClick = { point -> println("Series ${point.seriesIndex} in ${point.lineGroup.label}") },)Each LineGroup.values[i] is the value for series i at that x-position. Values are accumulated from bottom to top, so the topmost boundary is the sum of all series at each point.
fillAlpha is a chart-level parameter here (default 0.7f), not a config property — it must be in 0f..1f. Lower values keep the stacked layers readable where they overlap.
Click data: StackedAreaPoint(lineGroup, seriesIndex, dataIndex, value, cumulativeValue)
Interpolation#
StackedAreaChart honours LineInterpolation for every band, and the fill follows the same outline as the stroke above it. Earlier versions of the library ignored this setting on this chart; it is applied now.
lineConfig = LineChartConfig(interpolation = LineInterpolation.STEP)Legend#
lineConfig = LineChartConfig( legendLabels = listOf("Series A", "Series B", "Series C"), legendTextStyle = TextStyle(fontSize = 12.sp),)One entry per series, rendered as colour dots below the chart.
Rolling window#
StackedAreaChart( data = { groups }, modifier = Modifier.fillMaxWidth().height(320.dp), colors = ChartyColor.Gradient(listOf(Color(0xFF6650A4), Color(0xFFE91E63))), lineConfig = LineChartConfig(visibleWindow = 40, animation = Animation.Fast), fillAlpha = 0.5f,)The window applies to the list of LineGroups, so every band slides together. It must be null or at least 2.
Animating value changes#
lineConfig = LineChartConfig(animateValueChanges = true, animation = Animation.Fast)Crosshair#
StackedAreaChart( data = { groups }, modifier = Modifier.fillMaxWidth().height(320.dp), colors = ChartyColor.Gradient(listOf(Color(0xFF6650A4), Color(0xFFE91E63), Color(0xFF00BCD4))), fillAlpha = 0.5f, crosshair = ChartCrosshair(config = ChartCrosshairConfig(dismissOnRelease = true)),)The crosshair snaps to the top cumulative position at the nearest x and its label covers all series at that point. Note its data type: the crosshair here is a ChartCrosshair<LineGroup>, so a custom label receives the whole group.
crosshair = ChartCrosshair<LineGroup>( label = { Text(text = "${data.label}: total ${data.values.sum()}") },)lineConfig.crosshairConfig is the older equivalent; the crosshair parameter wins when both are set.
Tooltip#
StackedAreaChart has no tooltip parameter — tapping a band raises the built-in canvas tooltip only, styled through lineConfig.tooltipConfig and lineConfig.tooltipPosition. Its text is generated as "<group label>: <value>"; lineConfig.tooltipFormatter is not consulted.
Accessibility#
The chart attaches a generated stacked-area summary plus one focusable node per x-position for screen-reader traversal.
interactionConfig = ChartInteractionConfig(accessibilityDescription = "Quarterly revenue split by product line")Configuration#
StackedAreaChart uses LineChartConfig; see the full table on the LineChart page.
Limitations#
markersis present onLineChartConfigbutStackedAreaChartdoes not draw persistent markers.referenceBandis honoured, butreferenceLineis not drawn on this chart.lineConfig.fillAlphais ignored — use the chart-levelfillAlphaparameter.