AreaChart#
Best for emphasizing the volume or magnitude of a single series by filling the area beneath the line.
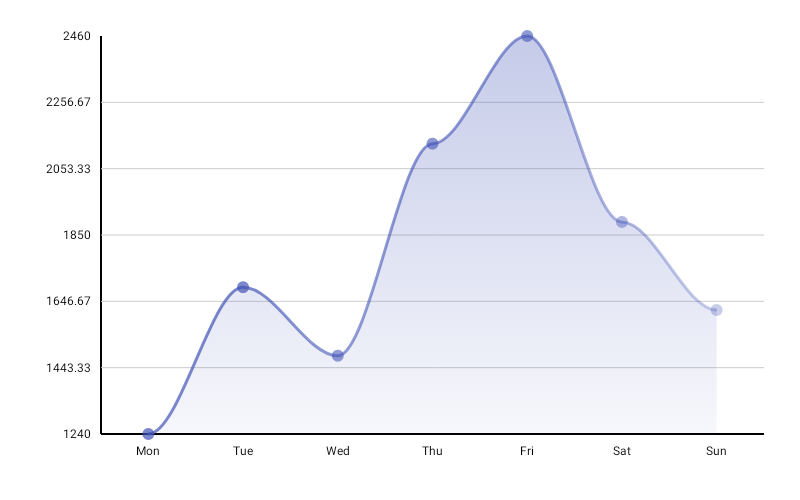
AreaChart( data = { listOf( LineData(label = "Week 1", value = 400f), LineData(label = "Week 2", value = 620f), LineData(label = "Week 3", value = 530f), LineData(label = "Week 4", value = 780f), LineData(label = "Week 5", value = 710f), ) }, modifier = Modifier.fillMaxWidth().height(300.dp), color = ChartyColor.Gradient(listOf(Color(0xFF6650A4), Color(0xFF03DAC5))), lineConfig = LineChartConfig( lineWidth = 2f, interpolation = LineInterpolation.SMOOTH, fillAlpha = 0.35f, animation = Animation.Default, ), onPointClick = { lineData -> println("${lineData.label}: ${lineData.value}") },)The fill opacity is lineConfig.fillAlpha — there is no chart-level fillAlpha parameter on AreaChart. (StackedAreaChart is the one that takes it as a parameter.)
A ChartyColor.Gradient paints both the line stroke and the fill; the fill is additionally faded by fillAlpha.
Interpolation#
AreaChart honours LineInterpolation for both the stroke and the fill, so the two never disagree along their shared outline.
AreaChart( data = { series }, modifier = Modifier.fillMaxWidth().height(300.dp), color = ChartyColor.Solid(Color(0xFF6650A4)), lineConfig = LineChartConfig(interpolation = LineInterpolation.STEP, fillAlpha = 0.25f),)LINEAR (default), SMOOTH, and STEP are available; the legacy smoothCurve flag is only consulted when interpolation is LINEAR.
Rolling window#
AreaChart( data = { readings }, modifier = Modifier.fillMaxWidth().height(300.dp), color = ChartyColor.Solid(Color(0xFF6650A4)), lineConfig = LineChartConfig(visibleWindow = 90, animation = Animation.Fast),)visibleWindow keeps only the last N points on screen and slides as data is appended. It must be null or at least 2.
Persistent markers#
A negative dataIndex counts back from the end of the drawn data, so dataIndex = -1 labels the newest point — the idiom for keeping a label pinned to the latest value of a rolling window.
AreaChart( data = { readings }, modifier = Modifier.fillMaxWidth().height(300.dp), color = ChartyColor.Solid(Color(0xFF6650A4)), lineConfig = LineChartConfig( visibleWindow = 90, markers = listOf(PersistentMarker(dataIndex = -1, showGuideLine = true)), ),)Animating value changes#
lineConfig = LineChartConfig(animateValueChanges = true, animation = Animation.Fast)Each point tweens to its new position when the data changes, and the fill follows the line.
Crosshair#
AreaChart( data = { series }, modifier = Modifier.fillMaxWidth().height(300.dp), color = ChartyColor.Solid(Color(0xFF6650A4)), crosshair = ChartCrosshair(config = ChartCrosshairConfig(showHorizontalLine = false)),)The crosshair snaps to the nearest point on drag and leaves taps alone. lineConfig.crosshairConfig is the older equivalent; the crosshair parameter wins when both are set.
Tooltip#
AreaChart( data = { series }, modifier = Modifier.fillMaxWidth().height(300.dp), color = ChartyColor.Solid(Color(0xFF6650A4)), tooltip = ChartTooltip.compose { Text(text = "${data.label}: ${data.value}") },)ChartTooltip.canvas() is the default; ChartTooltip.none() disables it.
Accessibility#
AreaChart attaches the generated line-chart summary plus one focusable node per data point for screen-reader traversal.
interactionConfig = ChartInteractionConfig(accessibilityDescription = "Weekly active users")Configuration#
AreaChart uses LineChartConfig; see the full table on the LineChart page. The properties that matter most here are fillAlpha, interpolation, lineWidth, showPoints, markers, and visibleWindow.
Two caveats on the shared config:
legendLabels,showGradientFill, andgradientFillAlphaare multi-series properties and have no effect onAreaChart.referenceBandis honoured, butreferenceLineis not drawn on this chart.