Compose Multiplatform
Charts that go everywhere Kotlin does
A sleek, lightweight charting library for Jetpack Compose — and, uniquely, for Kotlin Multiplatform: one codebase renders your charts on Android, iOS, Desktop, and the Web.
- 35 charts
- 5 targets
- minSdk 24
- Apache 2.0
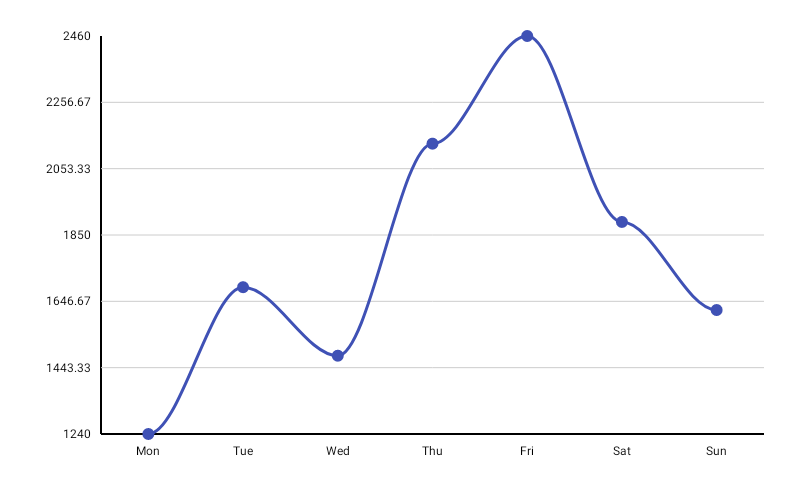
LineChart( data = { listOf(LineData("Mon", 20f), LineData("Tue", 45f), LineData("Wed", 30f)) }, color = ChartyColor.Solid(ChartyColors.Blue), lineConfig = LineChartConfig(interpolation = LineInterpolation.SMOOTH), crosshair = ChartCrosshair(),)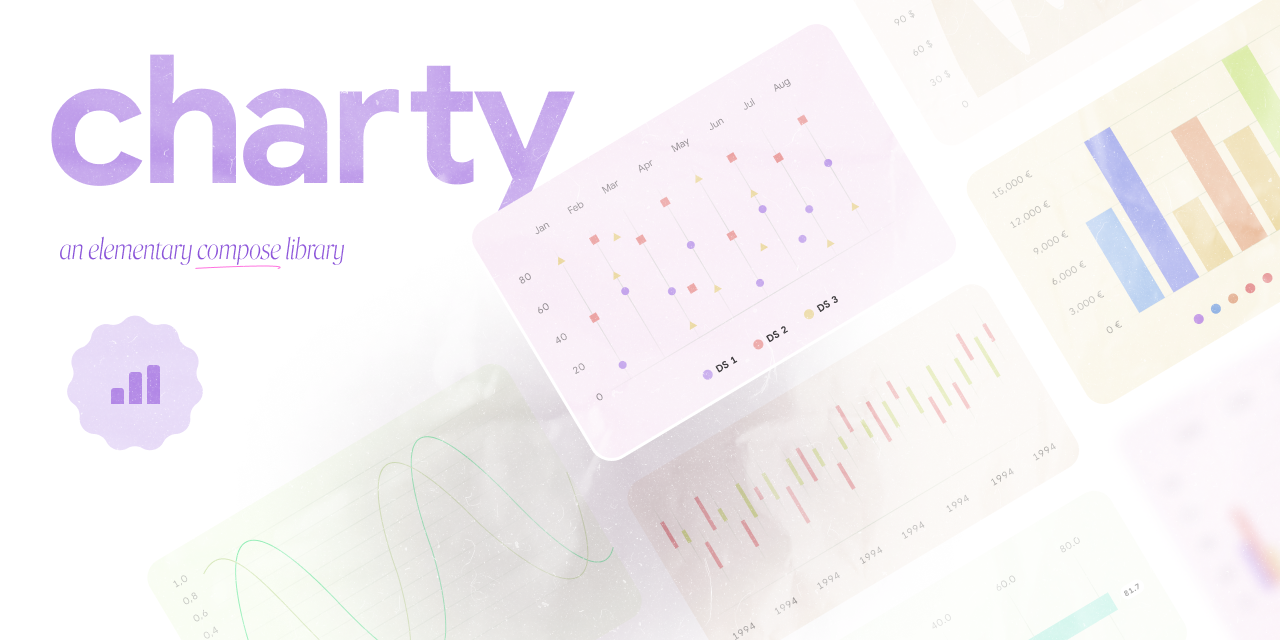
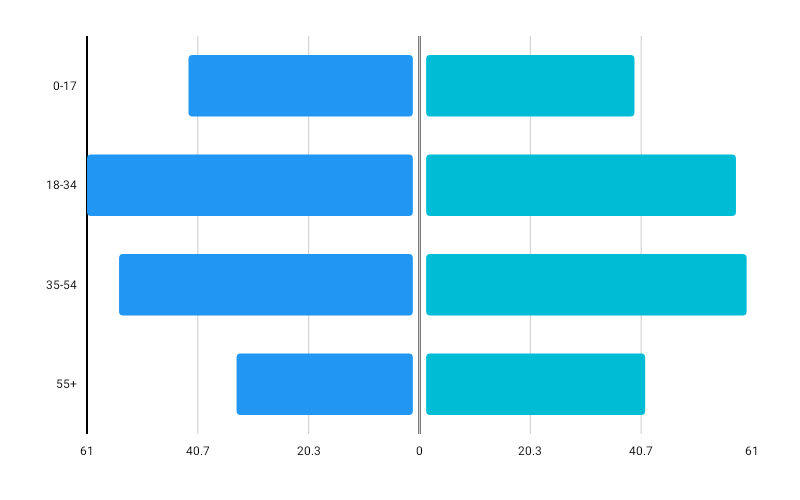
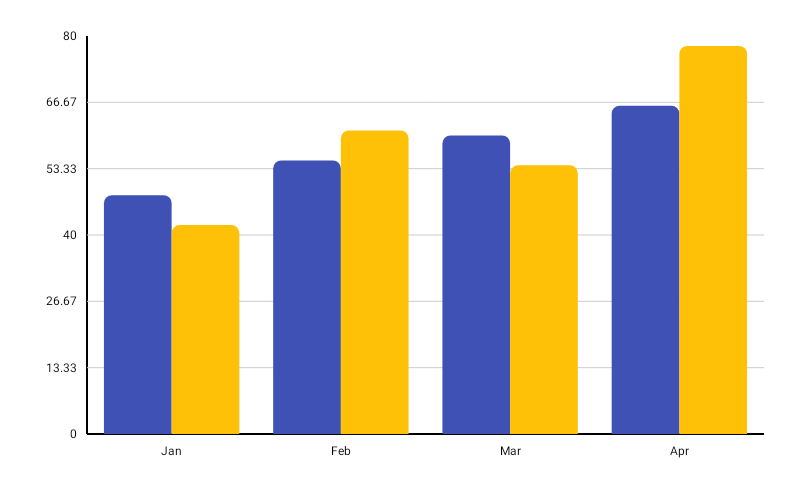
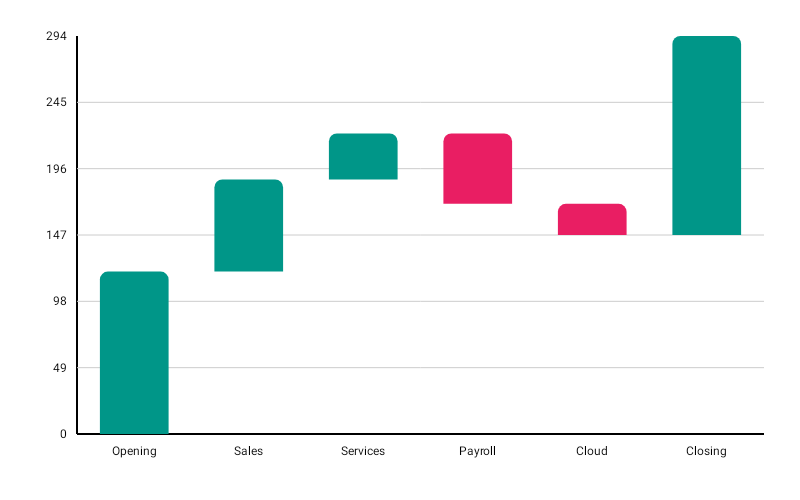
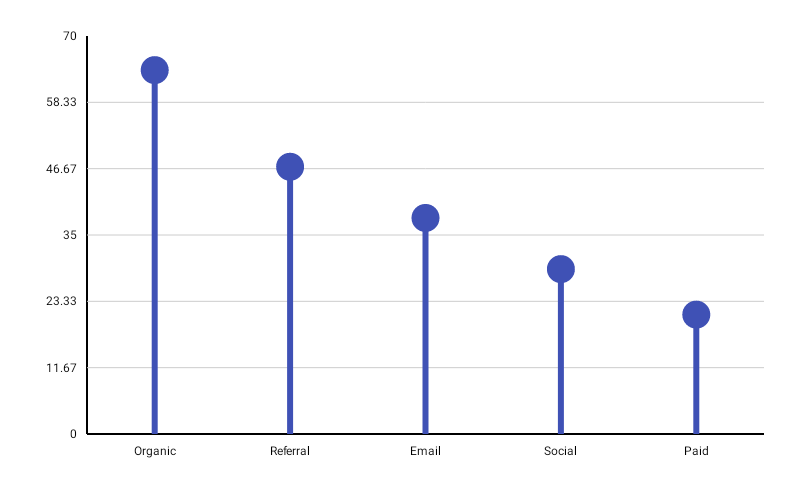
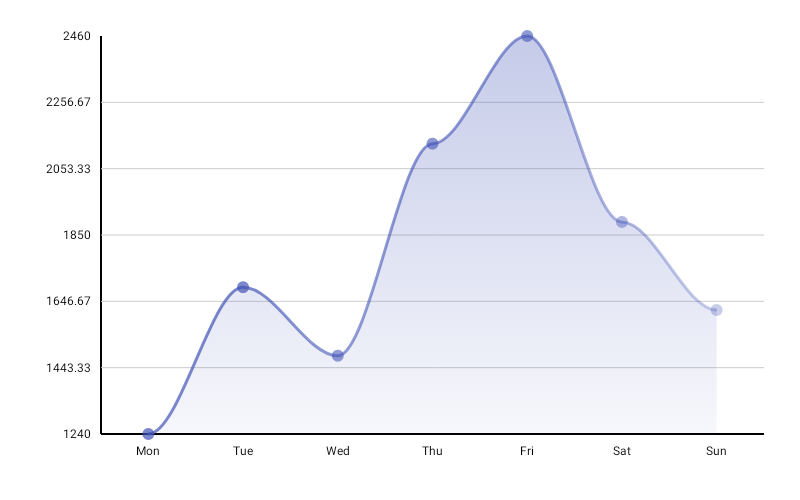
Drag to reveal the code, or the charts it draws.
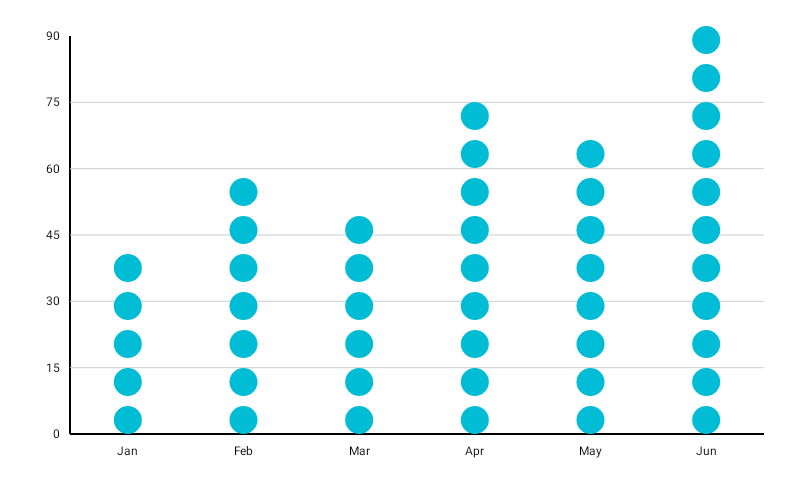
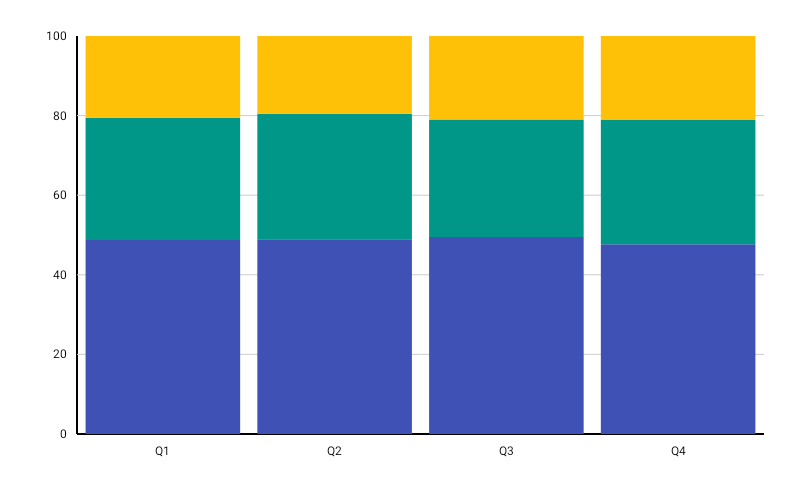
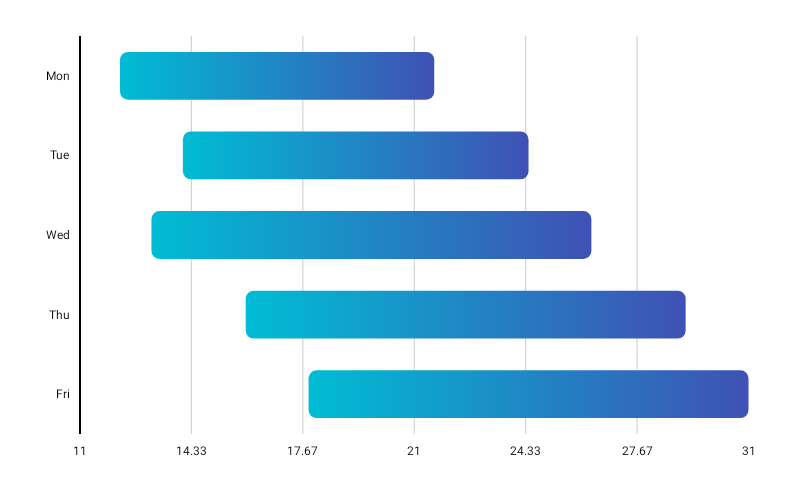
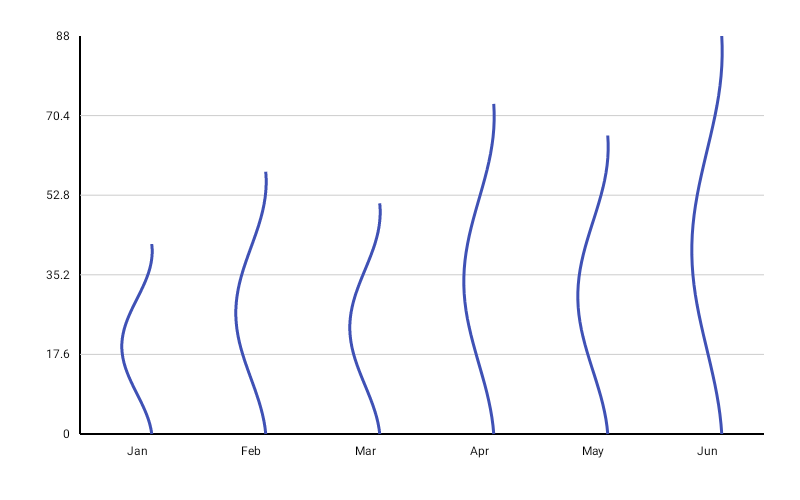


Everything in the box
The things you would otherwise build yourself, already built and documented.
One API, five targets
Android, iOS, JVM desktop, and JavaScript and WebAssembly in the browser, from a single commonMain call. Most Compose chart libraries are Android only.
Live data that behaves
A rolling window that slides as points arrive, an easing axis rescale, drag back through history, and a jump-to-latest pill when you have scrolled away.
Interactions that compose
A draggable crosshair, tap and drag tooltips drawn as your own Composable, persistent markers, zoom, pan, and brush selection — combined, not exclusive.
One crosshair, many charts
Wrap stacked charts in CrosshairSyncScope and a single guide line moves across all of them. Charts enrol themselves; you wire nothing.
Themed from one place
ChartyTheme carries typography, component colours, shapes and dimensions, and every chart resolves its unset configuration against it.
Built for large series
LTTB downsampling reduces tens of thousands of points to a shape-preserving subset before drawing, so a 50k-point line stays interactive.
Readable by screen readers
A generated whole-chart description and per-point traversal, so a chart can be read value by value instead of announced as one image.
Export anywhere
Capture any chart as a PNG and hand it to the platform: a share sheet on iOS, a download in the browser, the Downloads folder on desktop.
Every chart
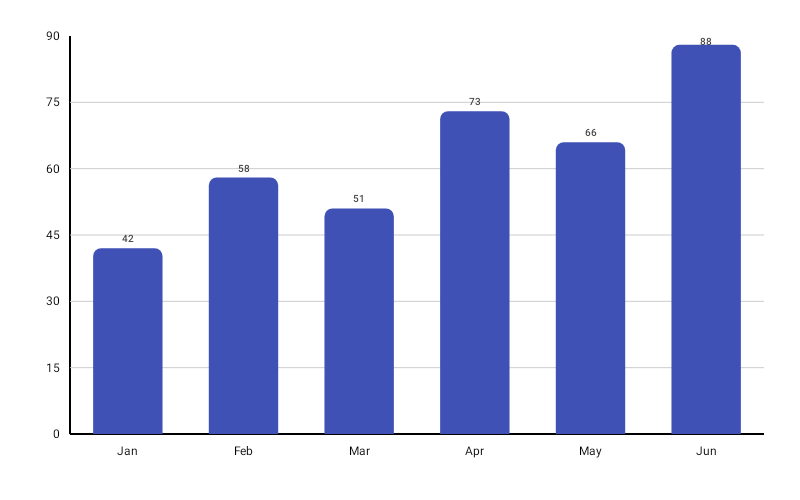
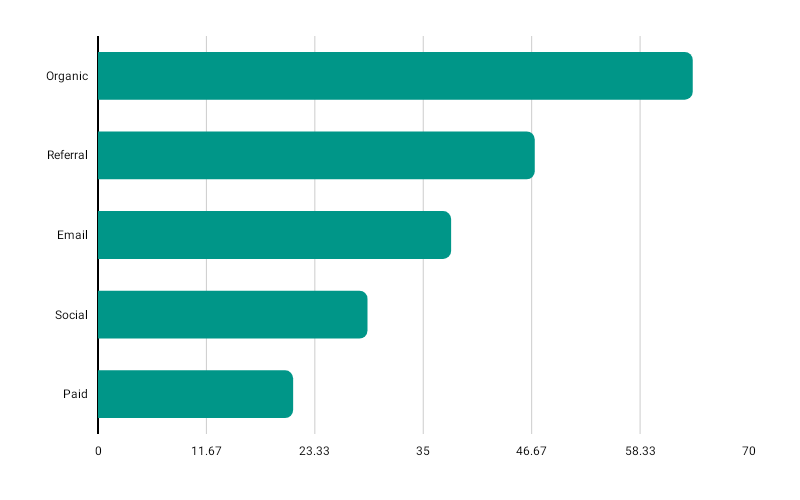
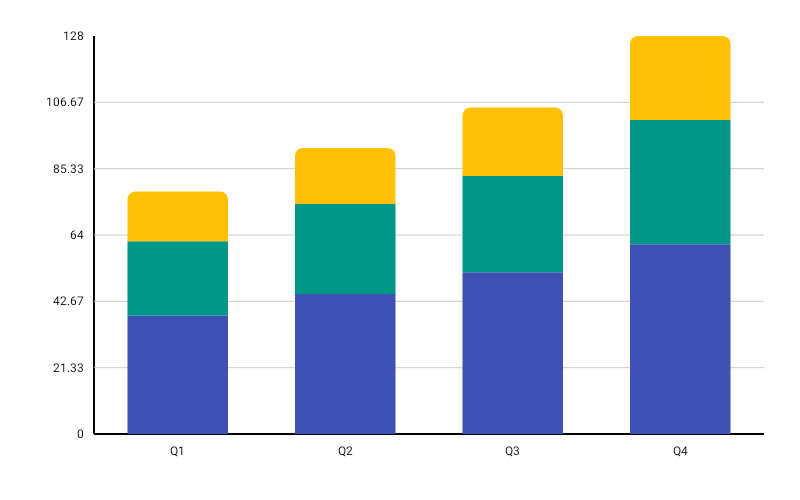
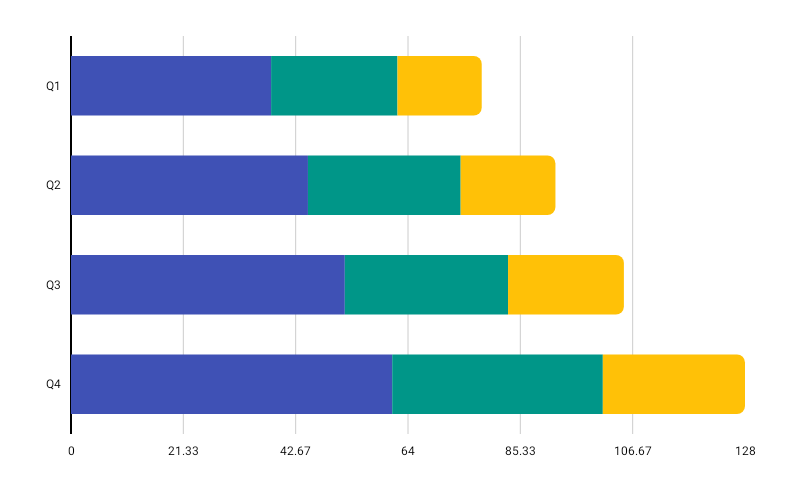
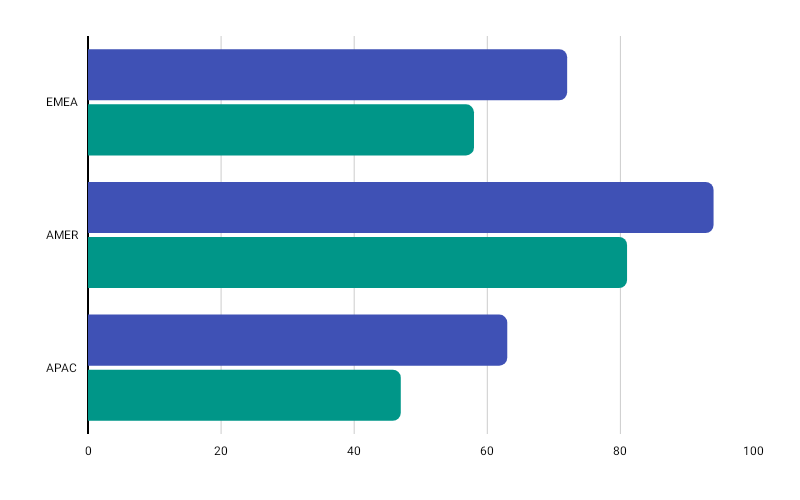
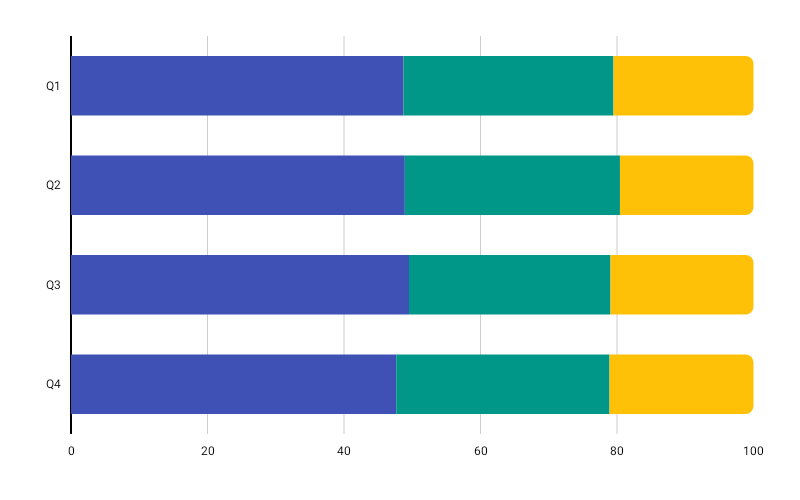
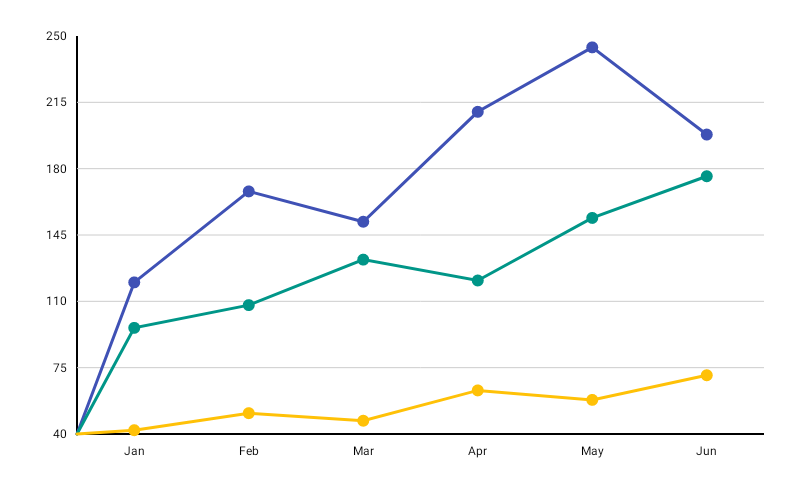
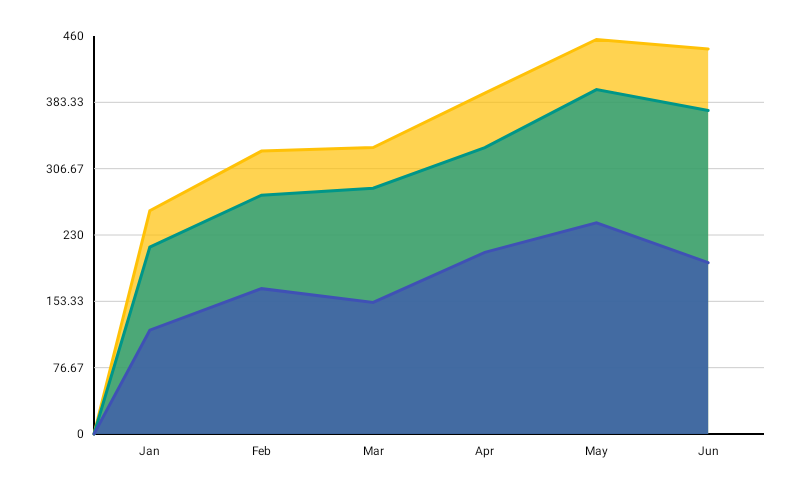
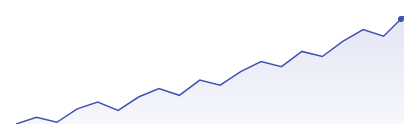
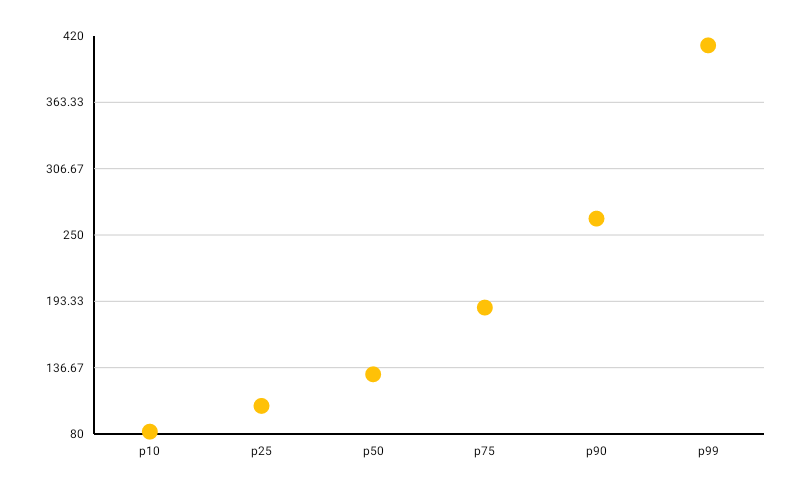
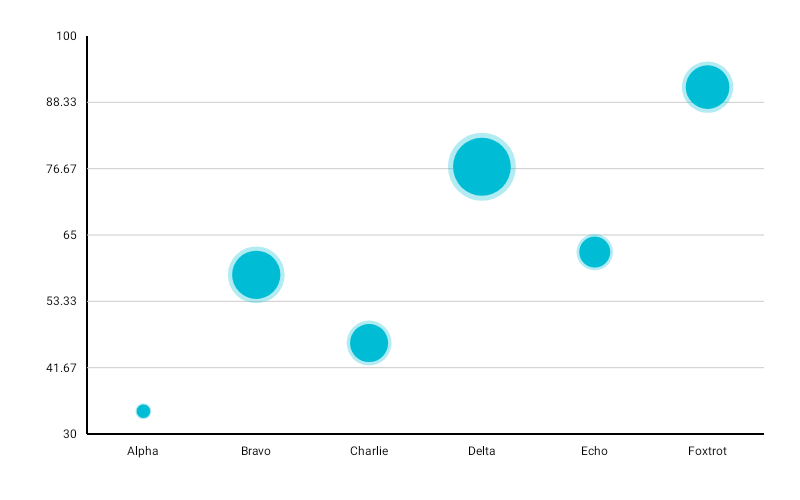
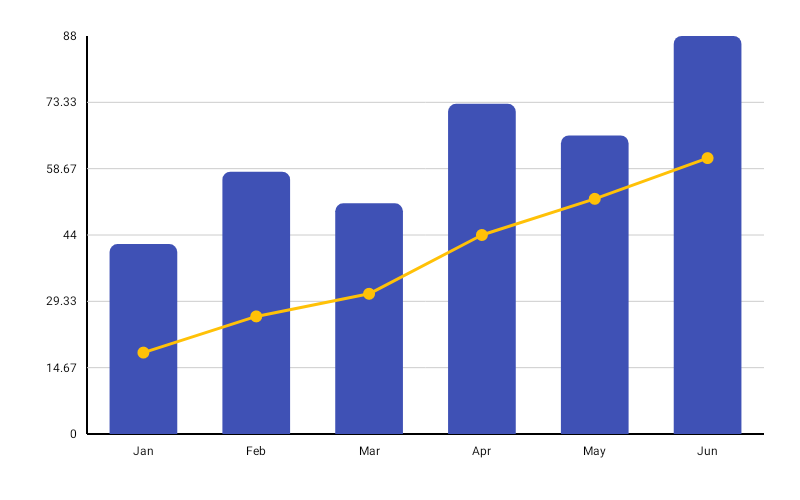
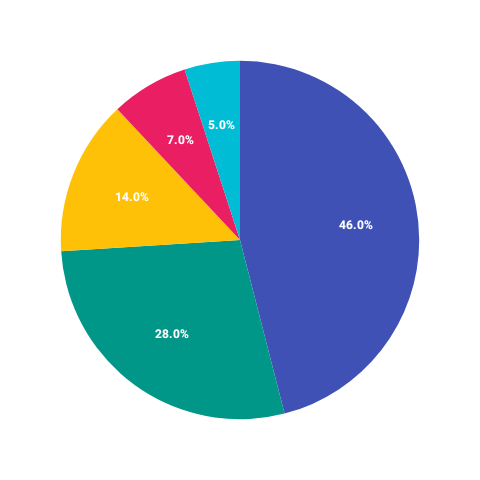
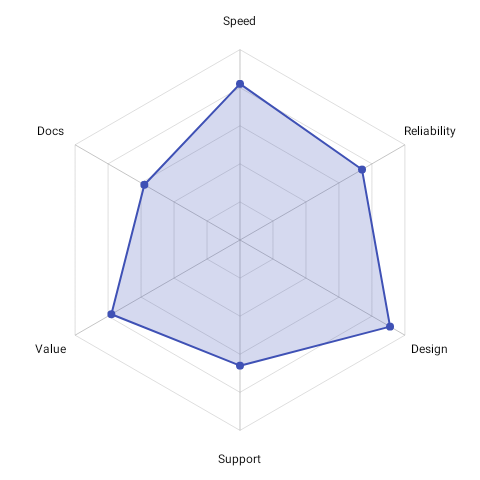
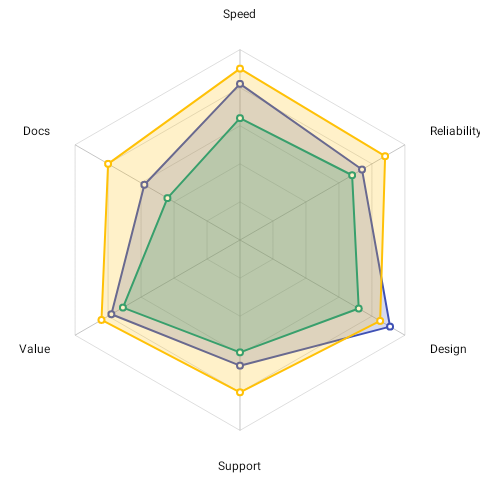
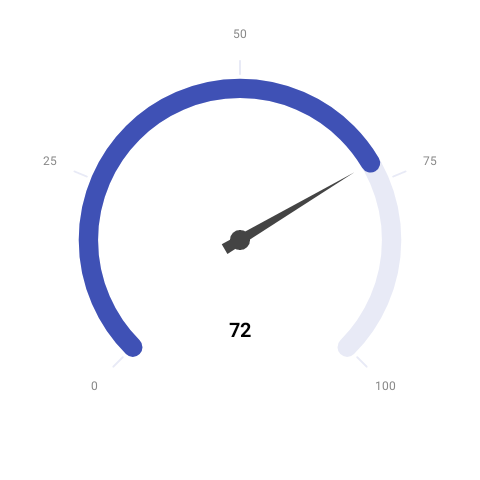
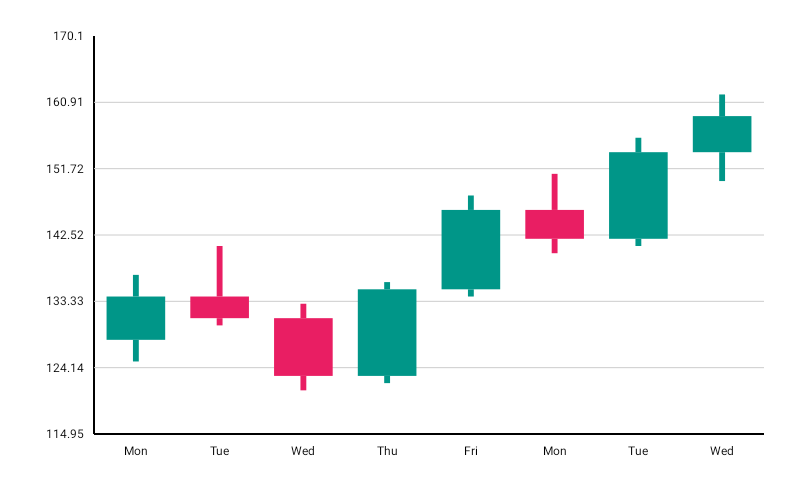
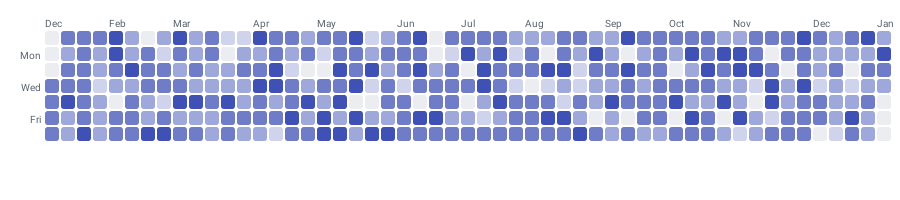
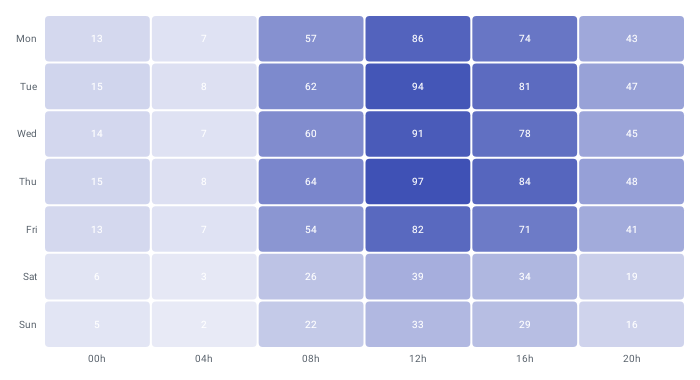
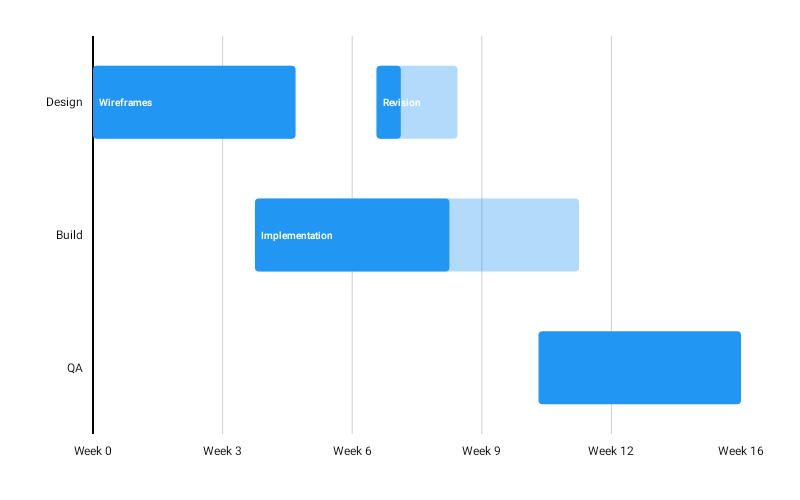
Each one has a page with a picture, the code that produced it, and its full configuration.
Bar charts 14
Line and area 5
Specialised 5
Write once
One dependency, one API, and the same rendering on every target.
commonMain.dependencies { implementation("com.himanshoe:charty:3.0.0") implementation("com.himanshoe:charty-3d:1.0.0")}
The 3D charts are a separate artifact on its own version, and every declaration in it is
@ChartyExperimental — see charty-3d for the
opt-in, and for an honest account of what tilting a chart costs you.
And it is quick
Charty reduces a large series to a shape-preserving subset before drawing, so a 50,000-point line stays interactive. Measured with JMH on a development machine — treat them as orders of magnitude rather than guarantees.
Start with a chart on screen
Two minutes from an empty file to something rendering, on whichever platform you are on.