BubbleChart#
Best for three-variable data where the category, the y-position, and a third variable (bubble size) are all meaningful.
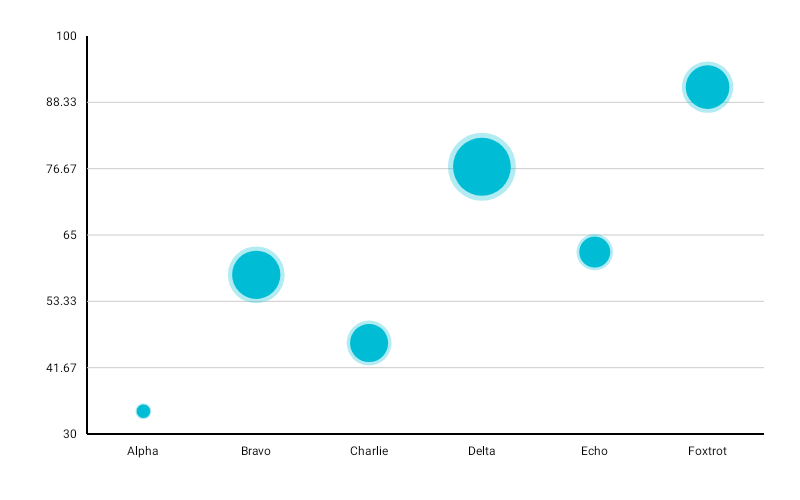
BubbleChart( data = { listOf( BubbleData(label = "Alpha", yValue = 200f, size = 40f), BubbleData(label = "Beta", yValue = 350f, size = 80f), BubbleData(label = "Gamma", yValue = 150f, size = 20f), BubbleData(label = "Delta", yValue = 420f, size = 60f), BubbleData(label = "Epsilon", yValue = 280f, size = 100f), ) }, modifier = Modifier.fillMaxWidth().height(320.dp), color = ChartyColor.Gradient(listOf(Color(0xFF6650A4), Color(0xFF03DAC5))), config = PointChartConfig(pointRadius = 24f, animation = Animation.Default), minBubbleRadius = 12f, onBubbleClick = { bubbleData -> println("${bubbleData.label}: y=${bubbleData.yValue}, size=${bubbleData.size}") },)size is interpolated between minBubbleRadius and config.pointRadius, which acts as the maximum radius here — not the fixed dot radius it is on PointChart.
config.pointRadius must be strictly greater than minBubbleRadius, or the chart throws. The defaults do not satisfy this: PointChartConfig().pointRadius is 8f while minBubbleRadius defaults to 10f, so calling BubbleChart without setting either raises an IllegalArgumentException. Always set pointRadius above your minBubbleRadius.
BubbleData.size must be positive and yValue must be finite. BubbleData also has an optional xValue, which the chart does not currently use for positioning — bubbles are laid out evenly by index.
Rolling window#
BubbleChart( data = { samples }, modifier = Modifier.fillMaxWidth().height(320.dp), color = ChartyColor.Solid(Color(0xFF6650A4)), config = PointChartConfig(pointRadius = 24f, visibleWindow = 30, animation = Animation.Fast), minBubbleRadius = 12f,)Keeps only the last N bubbles on screen; null or at least 2.
Persistent markers#
Markers anchor to bubble centres. A negative dataIndex counts back from the end of the drawn data, so -1 marks the newest bubble.
config = PointChartConfig( pointRadius = 24f, visibleWindow = 30, markers = listOf(PersistentMarker(dataIndex = -1, label = "Latest")),)A marker with no label shows the bubble's formatted yValue.
Animating value changes#
config = PointChartConfig(pointRadius = 24f, animateValueChanges = true, animation = Animation.Fast)Crosshair#
BubbleChart( data = { samples }, modifier = Modifier.fillMaxWidth().height(320.dp), color = ChartyColor.Solid(Color(0xFF6650A4)), config = PointChartConfig(pointRadius = 24f), minBubbleRadius = 12f, crosshair = ChartCrosshair(config = ChartCrosshairConfig(dismissOnRelease = true)),)The crosshair snaps to bubble centres by x-position and, being a drag gesture, leaves onBubbleClick intact. config.crosshairConfig is the older equivalent; the crosshair parameter wins when both are set.
Accessibility#
A generated bubble-chart summary ("Bubble chart, 5 bubbles. Y-axis range: … Largest bubble: …") plus one focusable node per bubble.
interactionConfig = ChartInteractionConfig(accessibilityDescription = "Deal size versus close rate by segment")Configuration#
BubbleChart uses PointChartConfig; see the full table on the PointChart page.
Limitations#
- No tooltip.
BubbleCharthas notooltipparameter and never raises the canvas tooltip, soconfig.tooltipConfig,tooltipPosition, andtooltipFormatterhave no effect. UseonBubbleClickor the crosshair to surface values. referenceLine,referenceBand,highlightSelectedColumn, anddownsampleThresholdfromPointChartConfigare not applied on this chart.- There is no size legend; render one yourself if the size mapping needs explaining.